
Industry 4.0
Maximize Efficiency. Minimize Downtime. Optimize Everything.
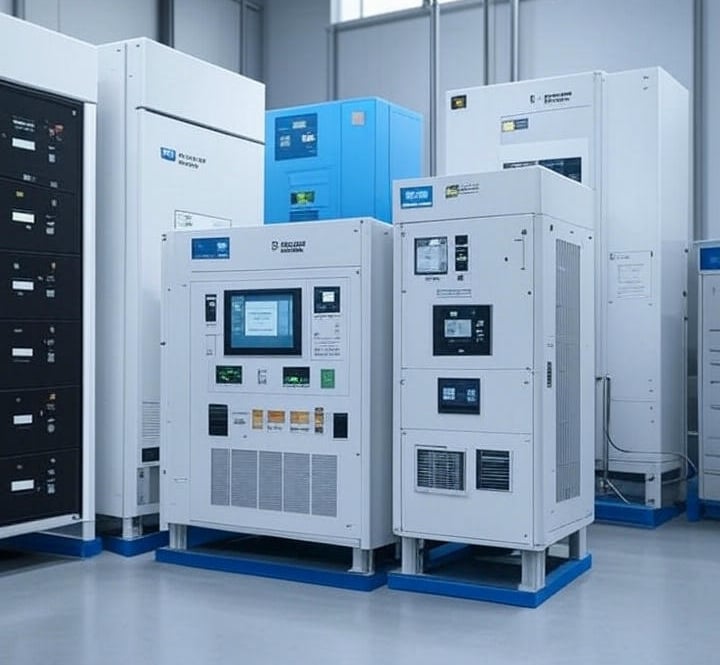
Factories & Manufacturing
Track and optimize your factory performance in real time with comprehensive KPIs. Gain visibility into energy consumption per unit, utilization rates, and asset health scores—enabling data-driven decisions, predictive maintenance, and higher productivity.
OEE (Overall Equipment Effectiveness) – Tracks availability, performance, and quality of machines.
MTTR (Mean Time to Repair) – Average time taken to restore equipment after failure.
MTBF (Mean Time Between Failures) – Time interval between two consecutive failures.
Cycle Time – Time taken to complete one production cycle or operation.
Downtime Logs – Monitoring of planned and unplanned machine downtime.
Throughput – Number of units produced per hour or shift.
Yield Rate – Ratio of good units to total units produced.
Energy Consumption per Unit – Power used (kWh) for producing each unit.
Utilization Rate – Comparison of actual usage vs. theoretical equipment capacity.
Asset Health Score – Condition-based score indicating machinery health.
OPERATIONAL METRICS
Building Management System (BMS)
Gain real-time visibility into building and workspace performance with powerful analytics. Monitor system availability, performance, and quality across HVAC, lighting, and energy assets. With insights into asset health and energy per use, drive predictive maintenance, reduce costs, and create a more efficient, responsive workplace.


Energy Usage (kWh) – Zone-wise or equipment-wise
Power Quality Metrics – Voltage, Current, Frequency, PF
Temperature & Humidity Trends – Per room/floor
CO₂ / AQI Monitoring – Indoor air quality index
Occupancy Rate – Room/zone presence detection
Lighting Usage – Active vs. idle lighting zones
DG/UPS Fuel & Load Monitoring – Run hours, fuel level, battery health
HVAC – Runtime and Efficiency
Leak Detection Events – Water/gas leak sensor logs
Fire/Smoke Events – Smart safety event logs
BUILDING METRICS
IT-OT Infrastructure
Ensure seamless and secure integration between IT and OT systems. Monitor network performance, protocol communication health, and device connectivity across all layers. Track cybersecurity events, unauthorized access, firmware vulnerabilities, and system integrity in real time. Our unified dashboard bridges operational and digital domains—offering complete visibility, threat alerts, and compliance support for a secure smart infrastructure.


Network Availability & Latency.
Gateway Connectivity Status.
Sensor Battery Health.
Data Packet Loss.
Access Control Logs.
SECURITY METRICS
Optional AI/ML Add-ons
Unlock deeper insights with AI/ML-powered analytics that go beyond traditional monitoring. Predict equipment failures before they occur, optimize energy usage patterns, detect anomalies in asset behavior, and forecast maintenance needs with precision. Our intelligent algorithms learn from historical and real-time data to drive proactive decision-making, minimize downtime, and enhance operational resilience.
Predictive Maintenance Alerts.
Anomaly Detection Scores Energy
Baseline Deviation Pattern
Clustering for Fault Types